Note
Go to the end to download the full example code.
Create an unplaced population
- Simple example showing how to create an unplaced axon population with NRV and plot an histogram of the diameters values. In this example population are either created:
From data (
tupple,numpy.ndarray,dictorpandas.DataFrame)
See also
from nrv.utils import geom
from nrv.nmod._axon_population import axon_population

import matplotlib.pyplot as plt
import numpy as np
from pandas import DataFrame
Generate population from data
n_ax = 10
# Randomly generate axon types and diameters
ax_type = np.random.randint(0,2,n_ax)
ax_diameters = np.random.random(n_ax)*20
When data are in a tupple
pop_tup = axon_population()
pop_tup.create_population_from_data((ax_type, ax_diameters))
pop_tup.axon_pop
When data are in a np.ndarray
data = np.vstack((ax_type, ax_diameters))
pop_np = axon_population()
pop_np.create_population_from_data(data)
pop_np.axon_pop
When data are in a dict
data = {"types":ax_type, "diameters":ax_diameters, "other_key":0}
pop_dict = axon_population()
pop_dict.create_population_from_data(data)
pop_dict.axon_pop
When data are in a dataframe
data = DataFrame({"types":ax_type, "diameters":ax_diameters, "other_key":np.random.rand(len(ax_type))})
pop_df = axon_population()
pop_df.create_population_from_data(data)
pop_df.axon_pop
Generate population from data
Small 20-axons population
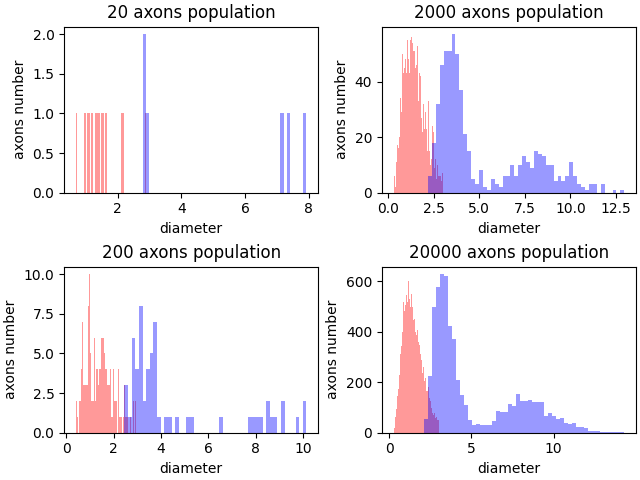
Histograms
fig, axs = plt.subplots(2, 2,  layout="constrained")
for _i, n_ax in enumerate([20, 200, 2000, 20000]):
    ax = axs[_i%2, _i//2]
    pop_stat = axon_population()
    pop_stat.create_population_from_stat(n_ax=n_ax)
    pop_stat.hist(axes=ax, unmyel_color=("r",.4), myel_color=("b",.4), bins=50)
    ax.set_title(f"{n_ax} axons population")
    ax.set_xlabel("diameter")
    ax.set_ylabel("axons number")

plt.show()
Total running time of the script: (0 minutes 0.374 seconds)