Note
Go to the end to download the full example code.
Propagation of spike along the axon
This code performs basic simulation showing the propagation of action potential along axons for both unmyelinated and myelinated (saltatory conduction) fibers.
import nrv
import matplotlib.pyplot as plt
if __name__ == '__main__':
# axon def
y = 0 # axon y position, in [um]
z = 0 # axon z position, in [um]
d = 6 # axon diameter, in [um]
L = 5000 # axon length, along x axis, in [um]
axon1 = nrv.myelinated(y,z,d,L,rec='all')
t_start = 0.1
duration = 0.5
amplitude = 0.35
amplitude = 0.195
axon2 = nrv.unmyelinated(y,z,d,L,dt=0.001,Nrec=2000)
axon1.insert_I_Clamp(0, t_start, duration, amplitude)
amplitude = 10
axon2.insert_I_Clamp(0, t_start, duration, amplitude)
results = axon1.simulate(t_sim=4.5)
del axon1
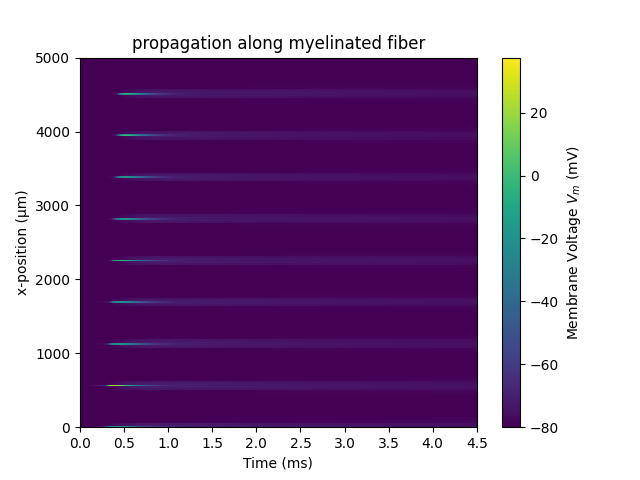
fig, ax = plt.subplots(1)
cbar = results.colormap_plot(ax, "V_mem")
ax.set_xlabel('Time (ms)')
ax.set_ylabel('x-position (µm)')
ax.set_title('propagation along myelinated fiber')
cbar.set_label(r'Membrane Voltage $V_m$ (mV)')
results = axon2.simulate(t_sim=4.5)
#nrv.rasterize(results,'V_mem')
del axon2
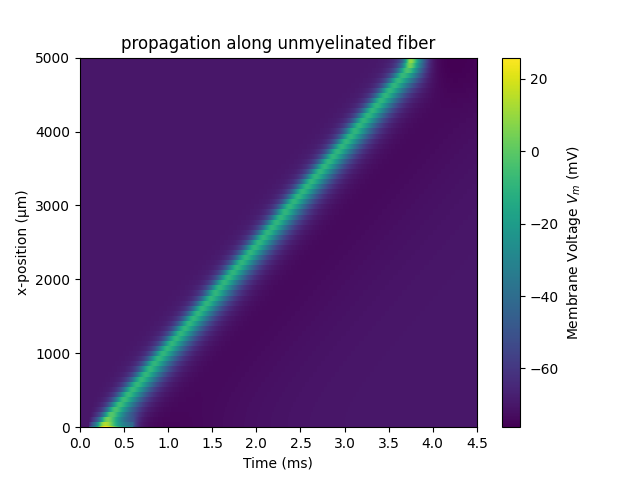
fig, ax = plt.subplots(1)
cbar = results.colormap_plot(ax, "V_mem")
ax.set_xlabel('Time (ms)')
ax.set_ylabel('x-position (µm)')
ax.set_title('propagation along unmyelinated fiber')
cbar.set_label(r'Membrane Voltage $V_m$ (mV)')
plt.show()
Total running time of the script: (0 minutes 2.029 seconds)