Note
Go to the end to download the full example code.
Access axon sub-poplation
Example showing two method to access sub population from axon_population.
- This example demonstrates how to:
Create axon populations for different shapes (circle, ellipse, polygon)
Place axons using both direct data and the placer
Use and highlight various placer arguments (delta, delta_trace, delta_in, method, fit_to_size, n_iter)
See also
from nrv.nmod._axon_population import axon_population
import matplotlib.pyplot as plt
import numpy as np
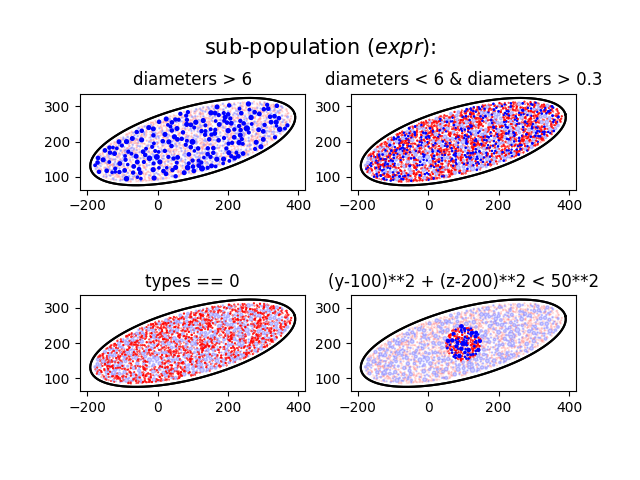
From pandas.DataFrame.eval() expression
center = (100, 200)
r = 300, 100
angle = -np.pi/12
n_ax = 2000
delta=1,
delta_trace=10

pop_1 = axon_population(center=center, radius=r, rot=angle, n_ax=n_ax, delta=delta, delta_trace=delta_trace)

expr_1 = "diameters > 6"
expr_2 = "types == 0"
expr_3 = "diameters < 6 & diameters > 0.3"
expr_4 = "(y-100)**2 + (z-200)**2 < 50**2"

fig, axs = plt.subplots(2,2)
pop_1.plot(axs[0,0], myel_color=("b", .2), unmyel_color=("r",.2))
pop_1.plot(axs[0,0], expr=expr_1, myel_color="b", unmyel_color="r")
axs[0,0].set_title(expr_1)

pop_1.plot(axs[1,0], myel_color=("b", .2), unmyel_color=("r",.2))
pop_1.plot(axs[1,0], expr=expr_2, myel_color="b", unmyel_color="r")
axs[1,0].set_title(expr_2)

pop_1.plot(axs[0,1], myel_color=("b", .2), unmyel_color=("r",.2))
pop_1.plot(axs[0,1], expr=expr_3, myel_color="b", unmyel_color="r")
axs[0,1].set_title(expr_3)

pop_1.plot(axs[1,1], myel_color=("b", .2), unmyel_color=("r",.2))
pop_1.plot(axs[1,1], expr=expr_4, myel_color="b", unmyel_color="r")
axs[1,1].set_title(expr_4)

fig.text(.5,.9, "sub-population ($expr$):", ha="center", va="center", size=15)


center = (100, 200)
r = 300, 100
angle = -np.pi/12
n_ax = 2000
delta=1,
delta_trace=10

pop_1 = axon_population(center=center, radius=r, rot=angle, n_ax=n_ax, delta=delta, delta_trace=delta_trace)

lab1 = "d_over_6"
pop_1.add_mask(pop_1.axon_pop["diameters"]>6, label=lab1)

lab2 = "unmyelinated"
pop_1.add_mask(pop_1.axon_pop["types"]==0, label=lab2)

lab31 = "d_under_6"
lab32 = "d_over_01"
pop_1.add_mask(~pop_1.axon_pop["d_over_6"], label=lab31)
pop_1.add_mask(pop_1.axon_pop["diameters"]>.1, label=lab32)


pop_1.add_mask((pop_1.axon_pop["y"]-center[0])**2+(pop_1.axon_pop["z"]-center[1])**2 < 50**2)
Placing... ━━━━━━━━━━━━━━━━━━━━━━━━━━━━━━━━━━━━━━━━ 100% 0:00:00
Placing... ━━━━━━━━━━━━━━━━━━━━━━━━━━━━━━━━━━━━━━━━ 100% 0:00:00

('mask_0', array([False, False, False, ..., False, False, False], shape=(2000,)))
From pandas.DataFrame.eval() expression
The
fig, axs = plt.subplots(2,2)
pop_1.plot(axs[0,0], myel_color=("b", .2), unmyel_color=("r",.2))
pop_1.plot(axs[0,0], mask_labels=lab1, myel_color="b", unmyel_color="r")
axs[0,0].set_title(lab1)

pop_1.plot(axs[1,0], myel_color=("b", .2), unmyel_color=("r",.2))
pop_1.plot(axs[1,0], mask_labels=lab2, myel_color="b", unmyel_color="r")
axs[1,0].set_title(lab2)

pop_1.plot(axs[0,1], myel_color=("b", .2), unmyel_color=("r",.2))
pop_1.plot(axs[0,1], mask_labels=[lab31, lab32], myel_color="b", unmyel_color="r")
axs[0,1].set_title([lab31, lab32])

pop_1.plot(axs[1,1], myel_color=("b", .2), unmyel_color=("r",.2))
pop_1.plot(axs[1,1], mask_labels="mask_0", myel_color="b", unmyel_color="r")
axs[1,1].set_title("mask_0 (default label)")

fig.text(.5,.9, "sub-population ($mask_labels$):", ha="center", va="center", size=15)

plt.show()
![d_over_6, ['d_under_6', 'd_over_01'], unmyelinated, mask_0 (default label)](../../_images/sphx_glr_22_access_subpopulation_002.png)
Total running time of the script: (0 minutes 12.338 seconds)