Note
Go to the end to download the full example code.
Conductance model dynamic with stimulation
This code highlith how to retrieve particle dynamics in results.
import nrv
import matplotlib.pyplot as plt
if __name__ == '__main__':
# nrvon def
y = 0 # nrvon y position, in [um]
z = 0 # nrvon z position, in [um]
d = 1 # nrvon diameter, in [um]
plot_node = 50
dt = 0.005
t_sim = 8
# first test pulse
L = 5000
t_start = 1
duration = 0.5
amplitude = 0.35
axon1 = nrv.unmyelinated(y,z,d,L,T = 21,model='HH',dt=0.001,Nrec=100)
axon1.insert_I_Clamp(0.5, t_start, duration, amplitude)
results = axon1.simulate(t_sim=t_sim,record_I_ions=True, record_particles=True)
del axon1
color_1 = "#1B148A"
color_2 = "#C60A00"
color_3 = "#009913"
color_4 = "#E2AD00"
V_rest= results['V_mem'][plot_node][0]
fig, axs = plt.subplots(2)
fig.set_size_inches(5, 7)
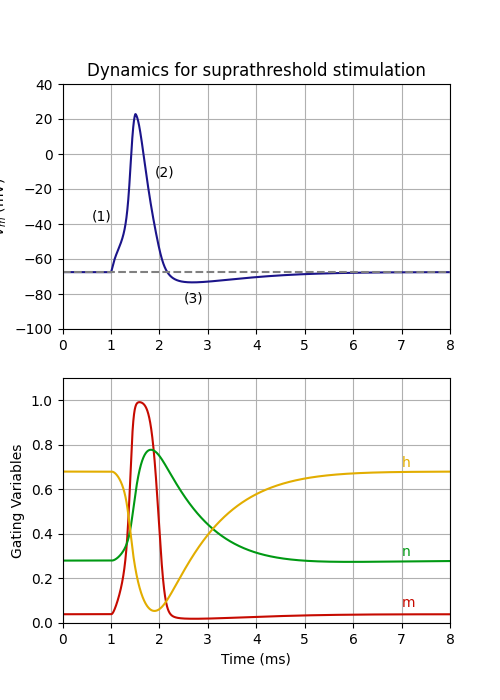
axs[0].plot(results['t'],results['V_mem'][plot_node],color = color_1,alpha = 1)
axs[0].axhline(y = V_rest, color = 'gray', linestyle = '--')
#axs[0].set_xlabel('time (ms)')
axs[0].set_ylabel('$V_m$ (mV)')
axs[0].set_xlim(0,t_sim)
axs[0].set_ylim(-100,40)
axs[0].grid(True)
axs[0].text(0.6,-38.0,'(1)')
axs[0].text(1.9,-13.0,'(2)')
axs[0].text(2.5,-85.0,'(3)')
axs[1].plot(results['t'],results['m'][plot_node],label='m',color = color_2,alpha = 1)
axs[1].plot(results['t'],results['n'][plot_node],label='n',color = color_3)
axs[1].plot(results['t'],results['h'][plot_node],label='h',color = color_4)
axs[1].set_xlabel('Time (ms)')
axs[1].set_ylabel('Gating Variables')
axs[1].set_xlim(0,t_sim)
axs[1].set_ylim(0,1.1)
axs[1].grid(True)
axs[1].text(7,0.70,'h',color = color_4)
axs[1].text(7,0.30,'n',color = color_3)
axs[1].text(7,0.07,'m',color = color_2)
axs[0].set_title('Dynamics for suprathreshold stimulation')
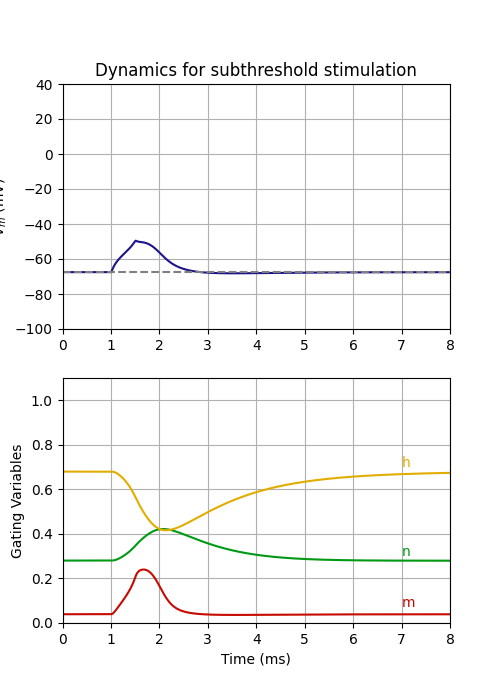
amplitude = 0.195
axon1 = nrv.unmyelinated(y,z,d,L,model='HH',dt=0.001,Nrec=100,T=21)
axon1.insert_I_Clamp(0.5, t_start, duration, amplitude)
results = axon1.simulate(t_sim=t_sim,record_I_ions=True, record_particles=True)
del axon1
V_rest= results['V_mem'][plot_node][0]
fig, axs = plt.subplots(2)
fig.set_size_inches(5, 7)
axs[0].plot(results['t'],results['V_mem'][plot_node],color = color_1,alpha = 1)
axs[0].axhline(y = V_rest, color = 'gray', linestyle = '--')
#axs[0].set_xlabel('time (ms)')
axs[0].set_ylabel(r'$V_m$ (mV)')
axs[0].set_xlim(0,t_sim)
axs[0].set_ylim(-100,40)
axs[0].grid(True)
axs[1].plot(results['t'],results['m'][plot_node],label='m',color = color_2,alpha = 1)
axs[1].plot(results['t'],results['n'][plot_node],label='n',color = color_3)
axs[1].plot(results['t'],results['h'][plot_node],label='h',color = color_4)
axs[1].set_xlabel('Time (ms)')
axs[1].set_ylabel('Gating Variables')
axs[1].set_xlim(0,t_sim)
axs[1].set_ylim(0,1.1)
axs[1].grid(True)
axs[1].text(7,0.70,'h',color = color_4)
axs[1].text(7,0.30,'n',color = color_3)
axs[1].text(7,0.07,'m',color = color_2)
axs[0].set_title('Dynamics for subthreshold stimulation')
plt.show()
Total running time of the script: (0 minutes 3.718 seconds)