Note
Go to the end to download the full example code.
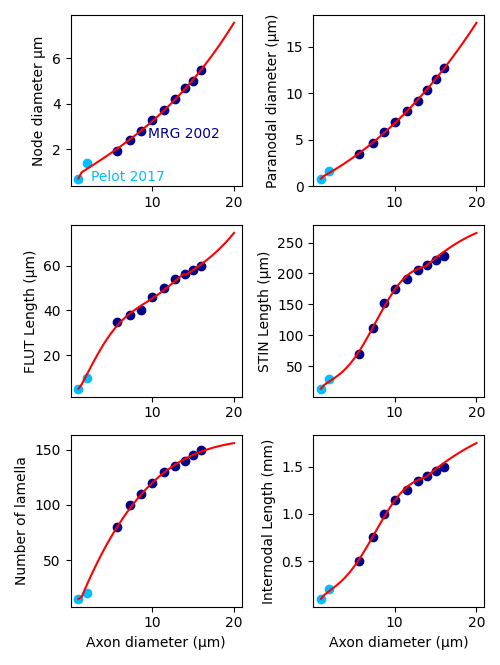
Plotting myelinated fibers structural parameters
This example shows how to plot structural parameters used in NRV’s myelinated fiber models.
import nrv
import matplotlib.pyplot as plt
import numpy as np

if __name__ == '__main__':
    fiberD  = np.asarray([5.7, 7.3, 8.7, 10.0, 11.5, 12.8, 14.0, 15.0, 16.0])
    fiberP  = np.asarray([1, 2])

    MRG_g = np.asarray([0.605, 0.630, 0.661, 0.690, 0.700, 0.719, 0.739, 0.767, 0.791])
    MRG_axonD = np.asarray([3.4, 4.6, 5.8, 6.9, 8.1, 9.2, 10.4, 11.5, 12.7])
    MRG_nodeD = np.asarray([1.9, 2.4, 2.8, 3.3, 3.7, 4.2, 4.7, 5.0, 5.5])
    MRG_paraD1 = np.asarray([ 1.9, 2.4, 2.8, 3.3, 3.7, 4.2, 4.7, 5.0, 5.5])
    MRG_paraD2 = np.asarray([ 3.4, 4.6, 5.8, 6.9, 8.1, 9.2, 10.4, 11.5, 12.7])
    MRG_deltax = np.asarray([ 500, 750, 1000, 1150, 1250, 1350, 1400, 1450, 1500])
    MRG_paralength2 = np.asarray([35, 38, 40, 46, 50, 54, 56, 58, 60])
    MRG_nl = np.asarray([ 80, 100, 110, 120, 130, 135, 140, 145, 150])

    P_g = np.asarray([0.565, 0.585])
    P_axonD = np.asarray([0.8, 1.6])
    P_nodeD = np.asarray([0.7, 1.4])
    P_paraD1 = np.asarray([0.7, 1.4])
    P_paraD2 = np.asarray([0.8, 1.6])
    P_deltax = np.asarray([100, 200])
    P_paralength2 = np.asarray([5, 10])
    P_nl = np.asarray([15, 20])

    paralength1 = 3
    nodelength = 1

    interlength_MRG = ((MRG_deltax-nodelength-(2*paralength1)-(2*MRG_paralength2))/6)
    interlength_P = ((P_deltax-nodelength-(2*paralength1)-(2*P_paralength2))/6)


    #interpolation
    diameters = np.linspace(1,20)
    g_interp = []
    axonD_interp = []
    nodeD_interp = []
    paraD1_interp = []
    paraD2_interp = []
    deltax_interp = []
    paralength2_interp = []
    nl_interp = []
    interlength_interp = []

    for diam in diameters:
        g, axonD, nodeD, paraD1, paraD2, deltax, paralength2, nl = nrv.get_MRG_parameters(diam)
        interlength_interp.append((deltax-nodelength-(2*paralength1)-(2*paralength2))/6)
        g_interp.append(g)
        axonD_interp.append(axonD)
        nodeD_interp.append(nodeD)
        paraD1_interp.append(paraD1)
        paraD2_interp.append(paraD2)
        deltax_interp.append(deltax)
        paralength2_interp.append(paralength2)
        nl_interp.append(nl)

    fig3, axs3 = plt.subplots(3, 2, figsize=(5, 5*1.33))
    axs3[0,0].scatter(fiberD,MRG_nodeD,color='darkblue')
    axs3[0,0].scatter(fiberP,P_nodeD,color='deepskyblue')
    axs3[0,0].plot(diameters,nodeD_interp,color='r')
    axs3[0,0].set_ylabel('Node diameter µm')
    axs3[0,0].text(2.5,0.6,"Pelot 2017",color='deepskyblue')
    axs3[0,0].text(9.5,2.5,"MRG 2002",color='darkblue')

    axs3[0,1].scatter(fiberD,MRG_paraD2,color='darkblue')
    axs3[0,1].scatter(fiberP,P_paraD2,color='deepskyblue')
    axs3[0,1].plot(diameters,paraD2_interp,color='r')
    axs3[0,1].set_ylabel('Paranodal diameter (µm)')

    axs3[1,0].scatter(fiberD,MRG_paralength2,color='darkblue')
    axs3[1,0].scatter(fiberP,P_paralength2,color='deepskyblue')
    axs3[1,0].plot(diameters,paralength2_interp,color='r')
    axs3[1,0].set_ylabel('FLUT Length (µm)')

    axs3[1,1].scatter(fiberD,interlength_MRG,color='darkblue')
    axs3[1,1].scatter(fiberP,interlength_P,color='deepskyblue')
    axs3[1,1].plot(diameters,interlength_interp,color='r')
    axs3[1,1].set_ylabel('STIN Length (µm)')

    axs3[2,0].scatter(fiberD,MRG_nl,color='darkblue')
    axs3[2,0].scatter(fiberP,P_nl,color='deepskyblue')
    axs3[2,0].plot(diameters,nl_interp,color='r')
    axs3[2,0].set_xlabel('Axon diameter (µm)')
    axs3[2,0].set_ylabel('Number of lamella')

    axs3[2,1].scatter(fiberD,MRG_deltax/1000,color='darkblue')
    axs3[2,1].scatter(fiberP,P_deltax/1000,color='deepskyblue')
    axs3[2,1].plot(diameters,np.array(deltax_interp)/1000,color='r')
    axs3[2,1].set_xlabel('Axon diameter (µm)')
    axs3[2,1].set_ylabel('Internodal Length (mm)')

    fig3.tight_layout()

    plt.show()
Total running time of the script: (0 minutes 0.510 seconds)