Conductance model dynamic with stimulation
This code highlith how to retrieve particle dynamics in results.
[ ]:
import nrv
import matplotlib.pyplot as plt
if __name__ == '__main__':
# nrvon def
y = 0 # nrvon y position, in [um]
z = 0 # nrvon z position, in [um]
d = 1 # nrvon diameter, in [um]
plot_node = 50
dt = 0.005
t_sim = 8
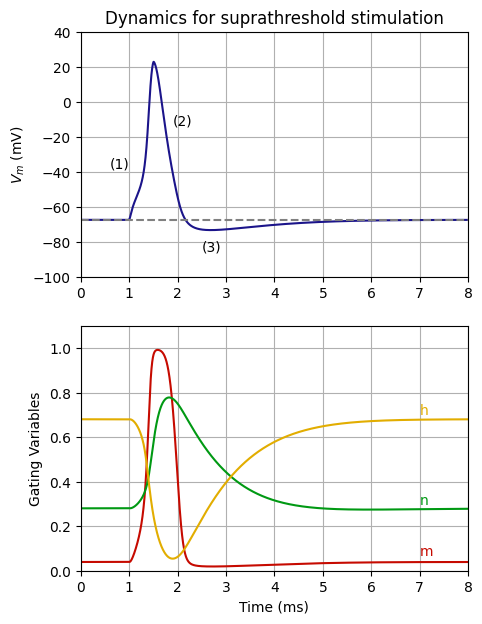
# first test pulse
L = 5000
t_start = 1
duration = 0.5
amplitude = 0.35
axon1 = nrv.unmyelinated(y,z,d,L,T = 21,model='HH',dt=0.001,Nrec=100)
axon1.insert_I_Clamp(0.5, t_start, duration, amplitude)
results = axon1.simulate(t_sim=t_sim,record_I_ions=True, record_particles=True)
del axon1
color_1 = "#1B148A"
color_2 = "#C60A00"
color_3 = "#009913"
color_4 = "#E2AD00"
V_rest= results['V_mem'][plot_node][0]
fig, axs = plt.subplots(2)
fig.set_size_inches(5, 7)
axs[0].plot(results['t'],results['V_mem'][plot_node],color = color_1,alpha = 1)
axs[0].axhline(y = V_rest, color = 'gray', linestyle = '--')
#axs[0].set_xlabel('time (ms)')
axs[0].set_ylabel('$V_m$ (mV)')
axs[0].set_xlim(0,t_sim)
axs[0].set_ylim(-100,40)
axs[0].grid(True)
axs[0].text(0.6,-38.0,'(1)')
axs[0].text(1.9,-13.0,'(2)')
axs[0].text(2.5,-85.0,'(3)')
axs[1].plot(results['t'],results['m'][plot_node],label='m',color = color_2,alpha = 1)
axs[1].plot(results['t'],results['n'][plot_node],label='n',color = color_3)
axs[1].plot(results['t'],results['h'][plot_node],label='h',color = color_4)
axs[1].set_xlabel('Time (ms)')
axs[1].set_ylabel('Gating Variables')
axs[1].set_xlim(0,t_sim)
axs[1].set_ylim(0,1.1)
axs[1].grid(True)
axs[1].text(7,0.70,'h',color = color_4)
axs[1].text(7,0.30,'n',color = color_3)
axs[1].text(7,0.07,'m',color = color_2)
axs[0].set_title('Dynamics for suprathreshold stimulation')
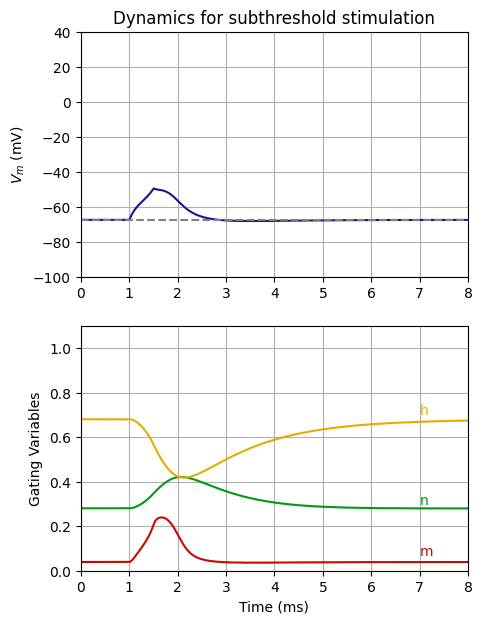
amplitude = 0.195
axon1 = nrv.unmyelinated(y,z,d,L,model='HH',dt=0.001,Nrec=100,T=21)
axon1.insert_I_Clamp(0.5, t_start, duration, amplitude)
results = axon1.simulate(t_sim=t_sim,record_I_ions=True, record_particles=True)
del axon1
V_rest= results['V_mem'][plot_node][0]
fig, axs = plt.subplots(2)
fig.set_size_inches(5, 7)
axs[0].plot(results['t'],results['V_mem'][plot_node],color = color_1,alpha = 1)
axs[0].axhline(y = V_rest, color = 'gray', linestyle = '--')
#axs[0].set_xlabel('time (ms)')
axs[0].set_ylabel(r'$V_m$ (mV)')
axs[0].set_xlim(0,t_sim)
axs[0].set_ylim(-100,40)
axs[0].grid(True)
axs[1].plot(results['t'],results['m'][plot_node],label='m',color = color_2,alpha = 1)
axs[1].plot(results['t'],results['n'][plot_node],label='n',color = color_3)
axs[1].plot(results['t'],results['h'][plot_node],label='h',color = color_4)
axs[1].set_xlabel('Time (ms)')
axs[1].set_ylabel('Gating Variables')
axs[1].set_xlim(0,t_sim)
axs[1].set_ylim(0,1.1)
axs[1].grid(True)
axs[1].text(7,0.70,'h',color = color_4)
axs[1].text(7,0.30,'n',color = color_3)
axs[1].text(7,0.07,'m',color = color_2)
axs[0].set_title('Dynamics for subthreshold stimulation')
Text(0.5, 1.0, 'Dynamics for subthreshold stimulation')