Note
Go to the end to download the full example code.
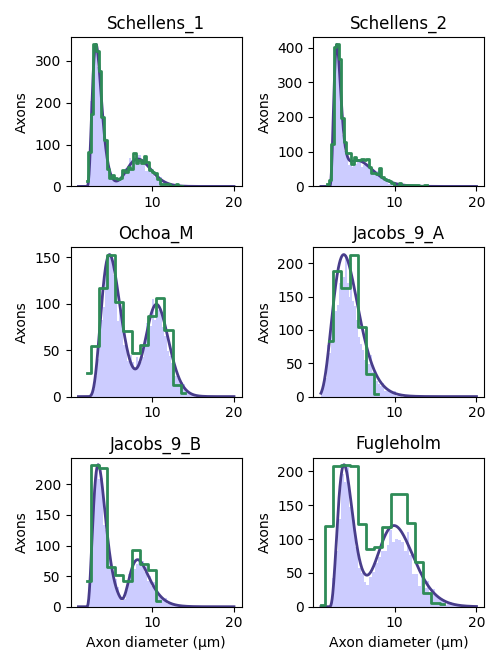
Plotting available axon diameter distributions in NRV
This example shows how to plot available axon diameter distributions in NRV
import nrv
import matplotlib.pyplot as plt
import numpy as np

myelinated_stats = [
    "Schellens_1",
    "Schellens_2",
    "Ochoa_M",
    "Jacobs_9_A",
    "Jacobs_9_B",
    "Fugleholm",
]

unmyelinated_stats = [
    "Ochoa_U",
    "Jacobs_11_A",
    "Jacobs_11_B",
    "Jacobs_11_C",
    "Jacobs_11_D",
    "Jacobs_11_D",
]

if __name__ == '__main__':
    N = 10000
    fig_idxs= [(0,0),(0,1),(1,0),(1,1),(2,0),(2,1)]
    xspace1 = np.linspace(1,20,num=500)

    fig1, axs1 = plt.subplots(3, 2, figsize=(5, 5*1.33))
    for k in range(len(myelinated_stats)):

        m_stat = myelinated_stats[k]
        u_stat = unmyelinated_stats[0]
        axons_diameters, axons_type, M_diam_list, U_diam_list = nrv.create_axon_population(N,M_stat=m_stat,U_stat=u_stat)

        y_M, x, _ = axs1[fig_idxs[k]].hist(M_diam_list,bins = 50,color = 'blue',alpha = 0.2)


        gen, popt1, pcov1 = nrv.create_generator_from_stat(m_stat)
        diam, pres = nrv.load_stat(m_stat)

        if (len(popt1)>4):
            data = (nrv.two_Gamma(xspace1, *popt1))
        else:
            data = (nrv.one_Gamma(xspace1, *popt1))
        scale_factor= np.max(y_M)
        data = data*scale_factor/np.max(data)
        pres = pres*scale_factor/np.max(pres)
        axs1[fig_idxs[k]].plot(xspace1,data,linewidth = 2,color ="darkslateblue")
        axs1[fig_idxs[k]].step(diam,pres,linewidth = 2,color ="seagreen",where="mid")

        axs1[fig_idxs[k]].set_title(m_stat)
        axs1[fig_idxs[k]].set_ylabel("Axons")

    axs1[fig_idxs[-1]].set_xlabel("Axon diameter (µm)")
    axs1[fig_idxs[-2]].set_xlabel("Axon diameter (µm)")
    fig1.tight_layout()


    plt.show()
Total running time of the script: (0 minutes 1.594 seconds)