Note
Go to the end to download the full example code.
Create a CShape geometry
- Simple example showing how to handle builtin 2D shapes. More precisely this example shows how to:
create shape by instantiating the corresponding class
create shape using the generic
create_cshape()-functionUse basic method implemented in CShape subclasses (
translate(),rotate(),get_point_inside())
See also
import nrv.utils.geom as geom
import matplotlib.pyplot as plt
import numpy as np

def plot_cshape(axes:plt.Axes, csh:geom.CShape, label:str):
    """
    Plot a CShape with its bounding box
    """
    # Plot the shape
    csh.plot(axes, label="Trace")

    # Plot its bounding box
    csh.plot_bbox(axes, "-+",color=("k",.2),label="bbox")

    # plt.axes parameters
    axes.set_aspect('equal', adjustable='box')
    axes.set_xlabel('Y-axis')
    axes.set_ylabel('Z-axis')
    axes.set_title(label)
    axes.grid(visible=True)
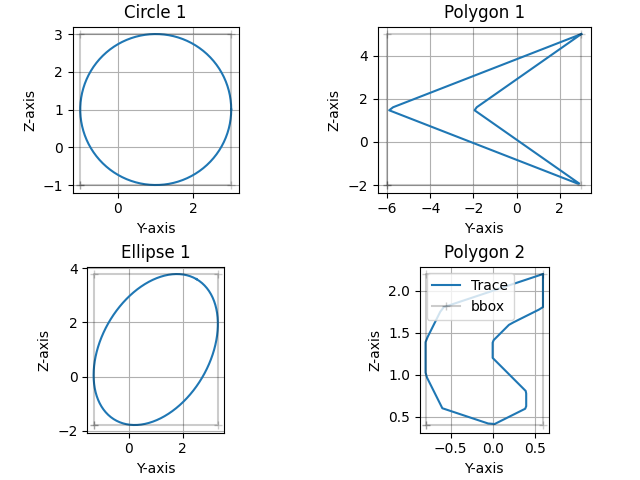
First method: from the classes
if __name__ == '__main__':

    fig, axs = plt.subplots(2, 2, layout="constrained")

    center = (1, 1)
    radius = 2
    circle = geom.Circle(center, radius)
    plot_cshape(axes=axs[0,0], csh=circle, label="Circle 1")


    center = 1, 1
    r = 3, 2
    angle = -np.pi/3 # Rotation angle in degrees
    ellipse = geom.Ellipse(center, r, angle)
    plot_cshape(axes=axs[1,0], csh=ellipse, label="Ellipse 1")


    points = [[-6,1.5],[3,-2], [-2,1.5],[3,5]]
    poly = geom.Polygon(vertices=points)
    plot_cshape(axes=axs[0,1], csh=poly, label="Polygon 1")


    points = [[0, 2],[-.6,1.8], [-.8, 1.4], [-.8, 1], [-.6, .6], [0, .4], [.4, .6], [.4, .8], [.2, 1], [0, 1.2], [0, 1.4], [.2, 1.6], [.6, 1.8], [.6, 2], [.6, 2.2]]
    poly = geom.Polygon(vertices=points)
    plot_cshape(axes=axs[1,1], csh=poly, label="Polygon 2")
    axs[1,1].legend()
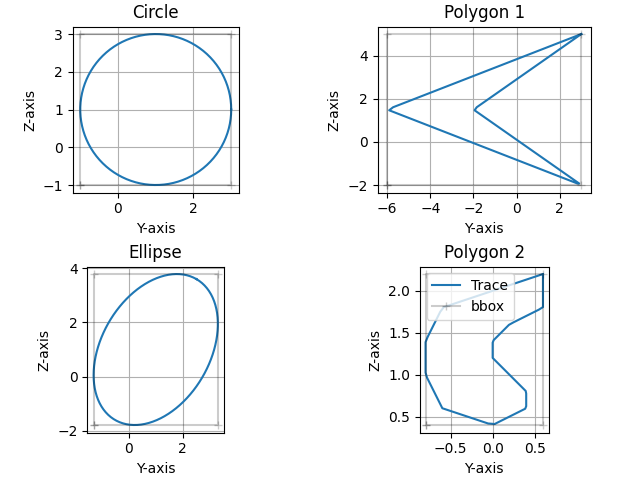
Second method: from create_cshape()
if __name__ == '__main__':

    fig, axs = plt.subplots(2, 2, layout="constrained")

    center = (1, 1)
    radius = 2
    circle = geom.create_cshape(center=center, radius=radius)
    plot_cshape(axes=axs[0,0], csh=circle, label="Circle")


    center = 1, 1
    r = 3, 2
    angle = -np.pi/3 # Rotation angle in degrees
    ellipse = geom.create_cshape(center=center, radius=r,rot=angle)
    plot_cshape(axes=axs[1,0], csh=ellipse, label="Ellipse")


    points = [[-6,1.5],[3,-2], [-2,1.5],[3,5]]
    poly1 = geom.create_cshape(vertices=points)
    plot_cshape(axes=axs[0,1], csh=poly1, label="Polygon 1")


    points = [[0, 2],[-.6,1.8], [-.8, 1.4], [-.8, 1], [-.6, .6], [0, .4], [.4, .6], [.4, .8], [.2, 1], [0, 1.2], [0, 1.4], [.2, 1.6], [.6, 1.8], [.6, 2], [.6, 2.2]]
    poly2 = geom.create_cshape(vertices=points)
    plot_cshape(axes=axs[1,1], csh=poly2, label="Polygon 2")
    axs[1,1].legend()
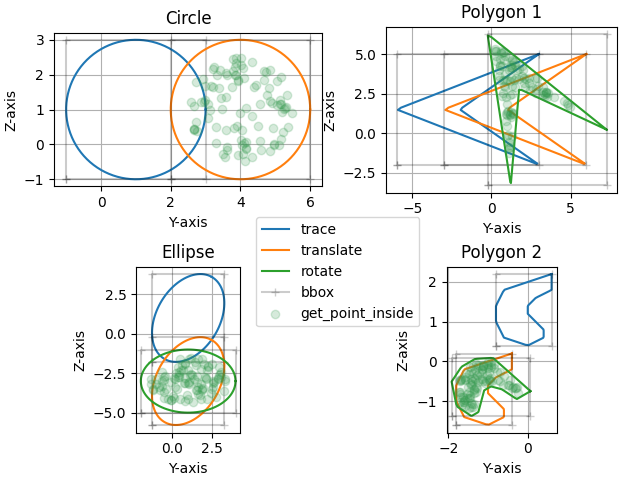
Implemented methods
if __name__ == '__main__':

    fig, axs = plt.subplots(2, 2, layout="constrained")

    plot_cshape(axes=axs[0,0], csh=circle, label="Circle")
    circle.translate(y=3)
    plot_cshape(axes=axs[0,0], csh=circle, label="Circle")
    inside_pts = circle.get_point_inside(100, delta=.5)
    axs[0,0].scatter(*inside_pts.T, color=(.2,.6,.3,.2), label='generated points', zorder=5)


    plot_cshape(axes=axs[1,0], csh=ellipse, label="Ellipse")
    ellipse.translate(z=-4)
    plot_cshape(axes=axs[1,0], csh=ellipse, label="Ellipse")
    ellipse.rotate(60, degree=True)
    plot_cshape(axes=axs[1,0], csh=ellipse, label="Ellipse")
    inside_pts = ellipse.get_point_inside(100, delta=.5)
    axs[1,0].scatter(*inside_pts.T, color=(.2,.6,.3,.2), label='generated points', zorder=5)


    plot_cshape(axes=axs[0,1], csh=poly1, label="Polygon 1")
    poly1.translate(y=3)
    plot_cshape(axes=axs[0,1], csh=poly1, label="Polygon 1")
    poly1.rotate(60, degree=True)
    plot_cshape(axes=axs[0,1], csh=poly1, label="Polygon 1")
    inside_pts = poly1.get_point_inside(100, delta=.2)
    axs[0,1].scatter(*inside_pts.T, color=(.2,.6,.3,.2), label='generated points', zorder=5)


    plot_cshape(axes=axs[1,1], csh=poly2, label="Polygon 2")
    poly2.translate(y=-1, z=-2)
    plot_cshape(axes=axs[1,1], csh=poly2, label="Polygon 2")
    poly2.rotate(60, degree=True)
    plot_cshape(axes=axs[1,1], csh=poly2, label="Polygon 2")
    inside_pts = poly2.get_point_inside(100, delta=.1)

    p = axs[1,1].lines[::2]
    p += [axs[1,1].lines[1]]
    p += [axs[1,1].scatter(*inside_pts.T, color=(.2,.6,.3,.2), label='generated points', zorder=5)]

    fig.legend(handles=p, labels=["trace", "translate", "rotate", "bbox", "get_point_inside"], loc=(.4,.32))
Total running time of the script: (0 minutes 1.241 seconds)